Google Doesn't Just Read Your Content — It Times You
Most business owners think Google ranking comes down to keywords, backlinks, and content quality. All true. But there's a fourth factor running quietly in the background on every single page Google crawls: how the page actually feels to use. Not "does it look nice" — does it load fast, respond instantly when tapped, and stay visually still while it loads. Google calls this bundle of measurements Core Web Vitals, and it has been a confirmed part of the ranking algorithm since 2021.
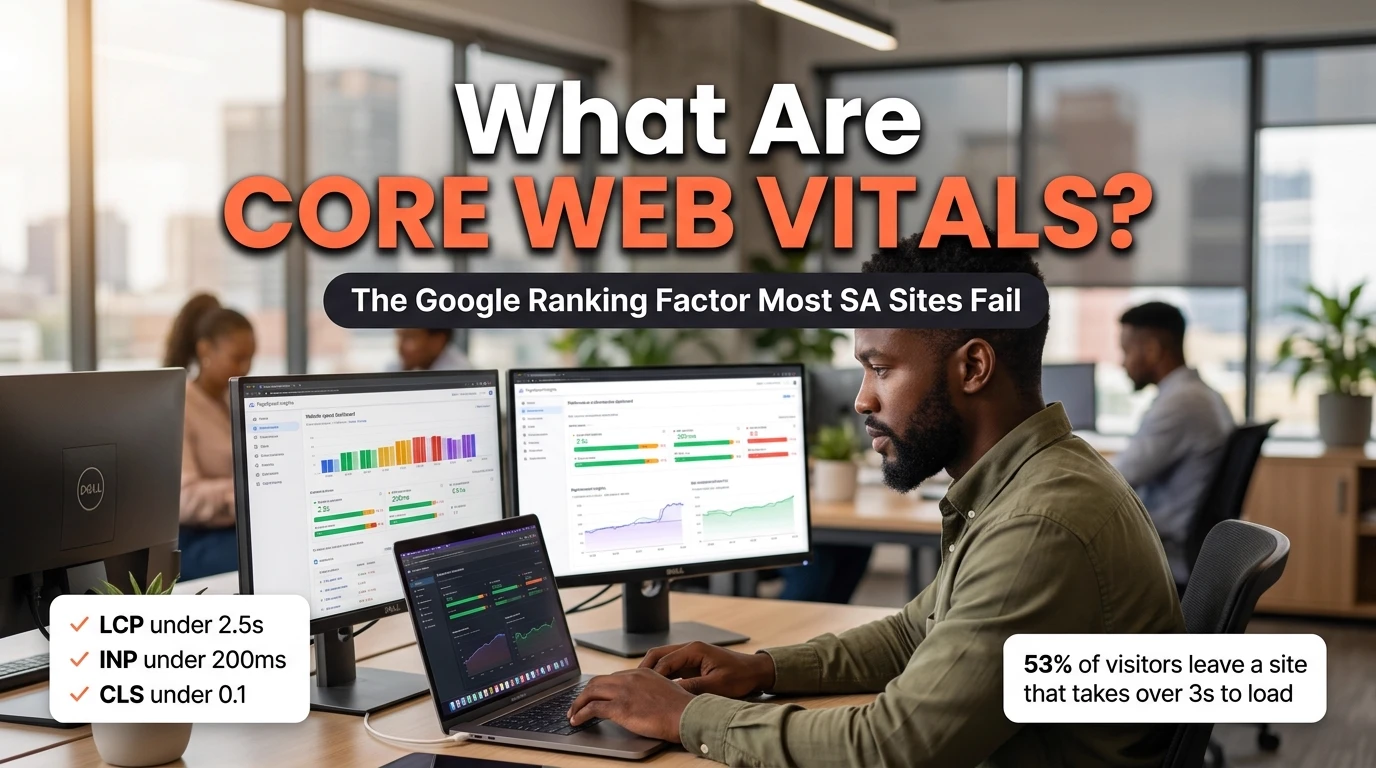
Here's the part that should worry most SA business owners: a Google-commissioned study found that 53% of mobile visitors abandon a site that takes longer than 3 seconds to load. That's not a ranking statistic — that's real people leaving before your homepage has even finished painting. Core Web Vitals measures exactly that moment, and turns it into three numbers Google can compare across every competing page in your industry.
The uncomfortable truth for a lot of SA websites — especially ones built on heavy page builders, stuffed with tracking scripts, or hosted on the cheapest shared plan available — is that they fail this test before a single visitor even reads a word of copy. Let's break down what's actually being measured.
The 3 Core Web Vitals, Explained in Plain English
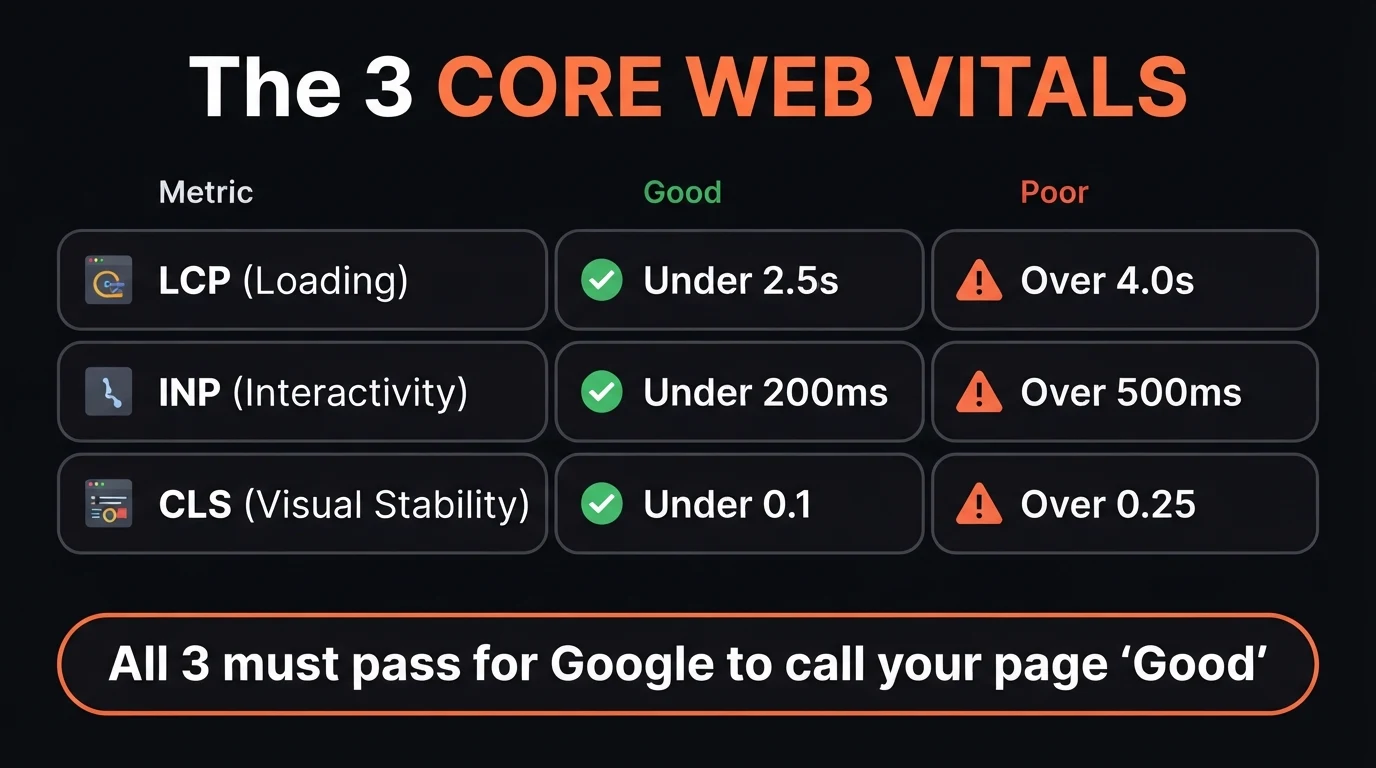
Google doesn't grade on a curve here. Each metric has a hard "good" threshold, and a page needs to pass all three before Google calls the overall experience good — one failing metric drags the whole score down, even if the other two are excellent.
| Metric | What it measures | Good score | Poor score |
|---|---|---|---|
| LCP | Loading — time until the largest visible element (usually your hero image or headline) finishes rendering | Under 2.5s | Over 4.0s |
| INP | Interactivity — how long the page takes to visibly respond after a visitor clicks, taps, or types | Under 200ms | Over 500ms |
| CLS | Visual stability — how much content jumps or shifts around while the page is still loading | Under 0.1 | Over 0.25 |
CLS is the one that catches most SA business owners off guard. It has nothing to do with speed — it's the reason your thumb hits the wrong button because an ad or image loaded a second late and pushed the whole page down. If you've ever tried to tap a menu item and accidentally opened a different one instead, you've experienced bad CLS firsthand.
"A Centurion-based plumbing business came to us ranking on page 2 for their main service keyword despite having decent content and a handful of reviews. Their old site — built on a bloated page builder with four tracking scripts stacked on top of each other — was scoring an LCP of 6.1 seconds on mobile. We rebuilt the site on lightweight, hand-coded pages with compressed imagery and no unnecessary scripts. LCP dropped to 1.9 seconds. Within five weeks, the page moved from position 14 to position 6 for the same keyword, with no other changes to the content itself. Speed was the only variable that changed."
Why Most South African Websites Fail at Least One Metric
In our experience auditing local business websites, the same three causes show up again and again:
- Uncompressed images — a 4-8MB photo straight from a phone, used as-is on the homepage
- Stacked third-party scripts — chat widgets, ad pixels, and page-builder bloat all loading at once
- Budget shared hosting — slow server response time before the page even starts rendering
- Web fonts and ads loading late — causing visible content to jump once they finally arrive
- Serve modern, compressed image formats (WebP) at the correct display size
- Cut every script that isn't earning its place — one chat widget, not three trackers
- Host on fast, SA-based servers with proper caching in place
- Reserve space for images and ads so nothing shifts once it loads
Before you keep reading: do you actually know your current scores? Guessing is pointless here — the next section takes two minutes and costs nothing.
How to Check Your Core Web Vitals for Free
You don't need to hire anyone to find out where you stand. Five tools, all free, will tell you exactly what's happening on your site right now:
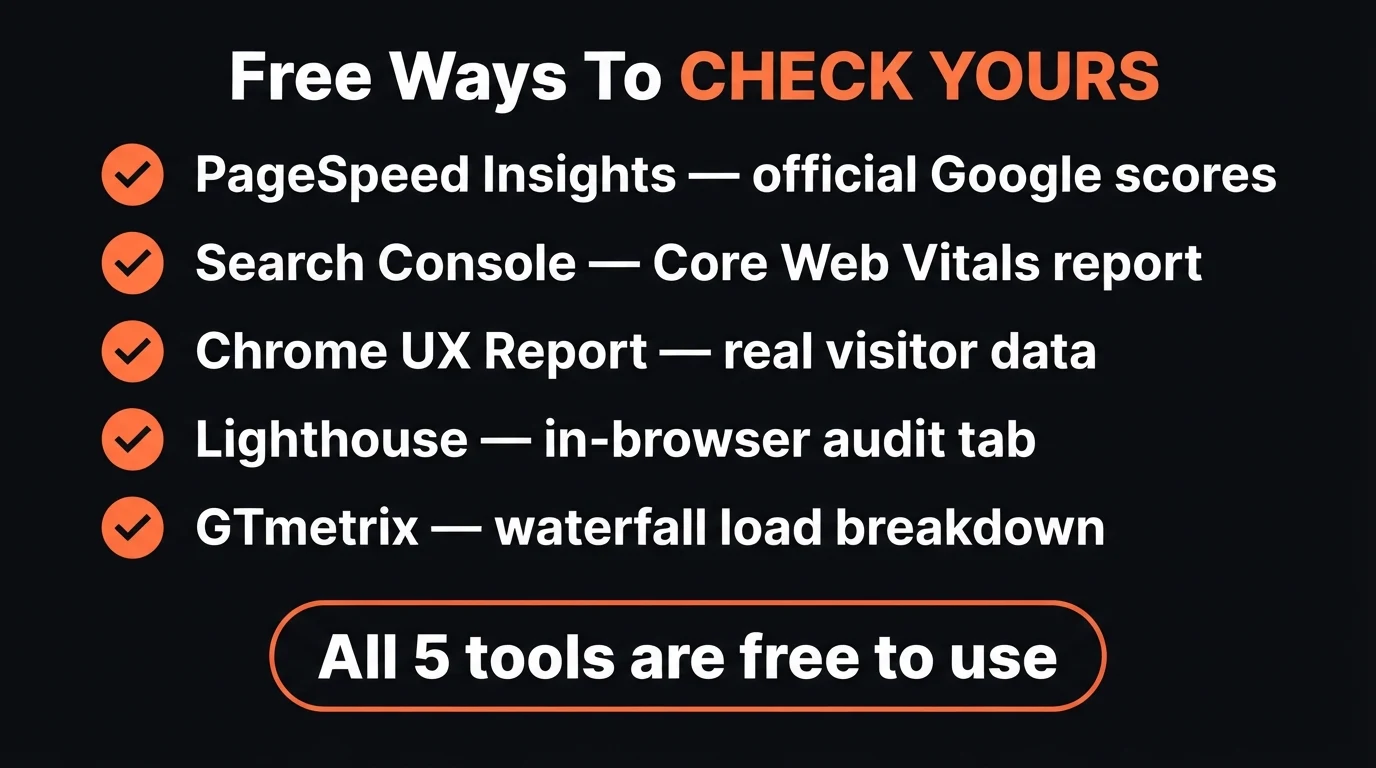
- PageSpeed Insights (pagespeed.web.dev) — paste your URL, get your live scores plus a plain-English list of what's slowing the page down. Start here.
- Google Search Console — the Core Web Vitals report shows every page on your site over time, grouped by "good," "needs improvement," and "poor."
- Chrome UX Report — real visitor data collected from actual Chrome users who loaded your site, not a lab simulation.
- Lighthouse — built into Chrome's DevTools (right-click → Inspect → Lighthouse tab) for a full in-browser audit.
- GTmetrix — a detailed waterfall breakdown of exactly which files are slowing your load time.
If you run PageSpeed Insights right now and see red or amber numbers, don't panic — you're in the majority, not the minority. But it does mean there's ranking headroom sitting on the table, and it's usually cheaper to fix than a content overhaul.
How CJX Studios Builds for Core Web Vitals by Default
Every CJX Studios site is hand-built rather than assembled from a bloated page-builder template — which means no unnecessary plugin scripts, compressed WebP images by default, and layouts that reserve space for every element before it loads. Core Web Vitals isn't an add-on service we upsell later; it's the baseline every site launches with, checked before we ever show you the live 48-hour demo.
Go Deeper: Related Guides
Find out your score. Free. No obligation.
Send Chris your website link on WhatsApp and get a plain-English Core Web Vitals check — what's failing, why, and what it would take to fix it, before you spend a cent.
Zero deposit · No lock-in · Pay only if you love it · From R1,200/mo
Frequently Asked Questions
What are Core Web Vitals?
Core Web Vitals are three metrics Google uses to measure real-world user experience on a webpage: Largest Contentful Paint (LCP, loading speed), Interaction to Next Paint (INP, responsiveness), and Cumulative Layout Shift (CLS, visual stability). Google uses these scores as a confirmed ranking factor for search results, alongside content quality and backlinks.
How do I check my Core Web Vitals score for free?
Go to PageSpeed Insights (pagespeed.web.dev), paste your URL, and run the test. It gives you your live LCP, INP and CLS scores plus a plain-English list of exactly what's slowing you down. Google Search Console's Core Web Vitals report shows the same data for every page on your site, tracked over time.
What is a good LCP, INP and CLS score?
Good scores are LCP under 2.5 seconds, INP under 200 milliseconds, and CLS under 0.1. Google needs all three metrics in the "good" range before it labels the page's overall experience as good — one failing metric drags the whole page down, even if the other two pass comfortably.
Do Core Web Vitals really affect Google rankings?
Yes. Google confirmed page experience, including Core Web Vitals, as a ranking signal in 2021. It's rarely the single strongest factor on its own, but in a competitive local search result where several businesses have similar content quality, Core Web Vitals is frequently the tie-breaker between position 3 and position 8.
Why do most South African business websites fail Core Web Vitals?
Three recurring causes: uncompressed images (a multi-megabyte photo straight from a phone), too many third-party scripts stacked on top of each other (chat widgets, ad trackers, page-builder bloat), and budget hosting with slow server response times. Any one of these alone can push LCP past the 2.5 second threshold — most struggling sites have all three at once.
- Core Web Vitals measures how your site actually feels to use — loading speed (LCP), responsiveness (INP), and visual stability (CLS) — and Google has ranked on it since 2021.
- All three must pass, not just one or two. A page with a fast LCP but jumpy layout still scores poorly overall.
- Checking your score is free and takes two minutes at pagespeed.web.dev — most SA business sites are failing at least one metric right now without knowing it.
Keep Reading

Chris Maboyi
I build websites for South African businesses in Centurion, Pretoria, and across Gauteng — hand-coded, compressed, and checked against Core Web Vitals before launch, not as an afterthought. Every site starts with a 48-hour free demo: real, live, no deposit, no obligation. Get in touch or WhatsApp me directly.